“Statistical Superstars: Exploring the Concepts of Average, Median, and Mode in Mathematics”
Introduction of Statistics Formulas
Calculating statistical averages is a fundamental skill in data analysis. Statistics is a branch of mathematics that deals with the collection, analysis, interpretation, presentation, and organization of data. Three key measures are mean, median, and mode, which are extensively taught in both Class 10th and Class 12th mathematics curriculums. Statistics Formulas deals with the collection of data and information for a particular purpose. Any data collection can be represented in multiple ways, like tables, graphs, pie charts, bar graphs, pictorial representation, etc.
What is Mean?
Mean (Average):
The mean is often referred to as the average. An average is a single number that summarizes a set of data. It aims to represent the “typical” value within that set.
Statistics Formulas of Mean
suppose we have n values in a set of data namely as x1, x2, x3, …, xn, then the mean of data is given by:

Application:
Mean is used in various fields, such as economics, where it helps calculate average income or expenditure. In Class 10th, students encounter practical problems involving mean, fostering real-world applications.
Statistics Formulas:
For grouped data, we can calculate the mean using three different methods.
| a = Assumed mean UI = (xi – a)/hh = Class size∑fi = Sum of all frequencies | Assumed mean method | Step deviation method |
| Mean∑fi = Sum of all frequencies | a = Assumed mean di = xi – a∑fi = Sum of all frequencies | a = Assumed mean UI = (xi – a)/h = Class size∑fi = Sum of all frequencies |
What is the Median?
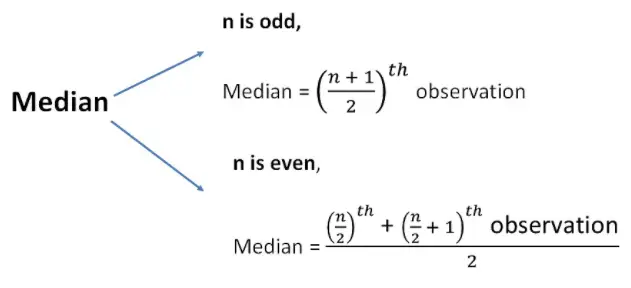
Median: The median is a statistical measure that represents the “middle” value in a set of data when arranged in ascending or descending order.
Example:
Finding the median income in a city: This tells you which income level divides the population into two halves, one earning less and the other earning more.
Consider the dataset: 10, 15, 20, 25, 30. The median is 20 since it is the middle value. If the dataset is extended to 10, 15, 20, 25, 30, and 35, the median is the average of 20 and 25, which is (20+25)/2=22.5
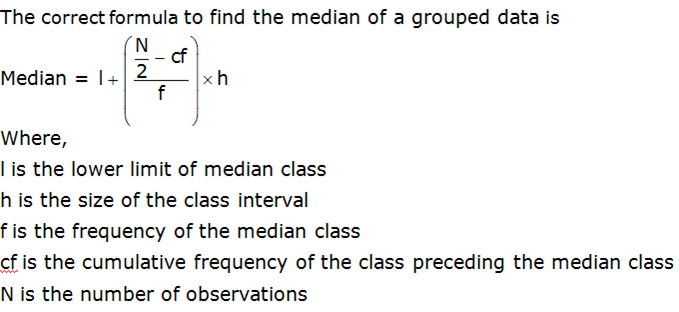
Statistical Formulas:
Application:
Median is valuable when dealing with skewed datasets, as it is less sensitive to extreme values. In Class 12th, students encounter more complex problems involving the median, preparing them for advanced statistical analysis.
What is Mode?
Mode:
The mode is the value that appears most frequently in a dataset. Unlike mean and median, mode is not affected by outliers or extreme values.
Example: In the dataset: 5, 10, 10, 15, 20, 20, 20, 25, the mode is 20 because it appears more frequently than any other value.
Statistics Formulas
We can calculate the mode for grouped data using the below Statistics Formulas:
Mode = L + (f 1– f 0/2f 1– f 0– f 2 ) h.
Application:
Mode is beneficial in scenarios where identifying the most common occurrence is essential, such as analyzing the most popular product in a market. In Class 10th and 12th, students learn to apply mode in various contexts.
Relation of Mean, Median, Mode
Empirical Relationship:
This applies to moderately skewed data distributions and states:
These Statistics Formulas essentially tells you that in moderately skewed data, the “most frequent” value (mode) is closer to the “middle” value (median) than the “average” value (mean).
General Characteristics:
However, it’s important to remember that this is an empirical relationship and doesn’t always hold true. Here’s a more general understanding of their relationship:
- Symmetrical Distribution: When data is perfectly symmetrical (like a bell curve), all three measures (mean, median, and mode) coincide at the center of the distribution.
- Positively Skewed Distribution:the order becomes Mean > Median > Mode.
- Negatively Skewed Distribution: the order becomes Mean < Median < Mode.
- Multimodal Distribution: With multiple peaks in the data, there can be multiple modes, and the relationship between mean, median, and mode becomes less meaningful.
Class 10th Mathematics Statistics Formulas:
In Class 10th, the focus is on building a strong foundation in basic statistical concepts. As a class 10th student, you’re about to embark on this exciting journey, and three essential companions await you: mean, median, and mode. Each holds a unique power, and understanding their significance is like equipping yourself with the right tools to explore the fascinating world of data analysis.
Each measure offers a unique perspective:
Mean: Perfect for symmetrical data (like test scores) where a central value is meaningful.
Median: Ideal for skewed data (like waiting times) where outliers might distort the mean.
Mode: Useful for identifying trends and preferences (like favorite sports teams).
Practical examples and problems in the textbook help students understand the real-world implications of these measures of central tendency.
Class 12th Mathematics Statistics Formulas:
As students progress to Class 12th, problems involving mean, median, and mode complexity increase. They learn about cumulative frequency distribution, quartiles, and other advanced statistical concepts. mathematics equips students with the skills necessary for statistical analysis in various academic and professional fields. the trio of mean, median, and mode transforms from basic tools to versatile allies in your analysis.
- The Mean: It reflects the average price, providing a general sense of the market’s performance. But, a single outlier like a major crash can significantly distort it.
- The Median: It represents the price that divides the market in half, offering a more stable measure amidst volatility. This is crucial for understanding the experience of most investors.
- The Mode: It reveals the most frequent price, highlighting potential support or resistance levels. This can aid in predicting future trends and making informed investment decisions.
Frequently Asked Questions (FAQs):
Q1: What is the significance of calculating the mean?
A: A: Calculating the mean is significant for several reasons: Central Location, Summarization, Comparisons, Population Parameter, and Arithmetic Simplicity.
Q2: When is the median more useful than the mean?
A: The median is more useful than the mean when dealing with skewed datasets or datasets with outliers. It provides a more accurate representation of the central value in such cases.
Q3: How is mode useful in real-world situations?
A: The mode is useful in real-world situations for identifying the most frequent occurrence or value in a dataset, aiding in decision-making and resource allocation in fields such as education, business, healthcare, transportation, and more.
Q4: What is the importance of understanding these measures in daily life?
A: Understanding mean, median, and mode is essential in various aspects of daily life, from making informed decisions about personal finances to interpreting data in news reports or research studies.
Q5: How do these concepts prepare students for future studies and careers?
A: Understanding statistical concepts equips students with essential analytical and problem-solving skills, preparing them for future studies and careers by enabling informed decision-making and data-driven insights across various fields.